These are five features use often (apart from the last, never used that one!) about the developer tools in Firefox and Chrome. I thought I would blog about the similar features in both browsers instead of focusing on one of them, and show how to use them in both of them.
Emulating element states (hover, focus, etc.)
One of my favourite features, which makes things much less a pain, is the ability to trick the browser to think that you’re hovering over an element until you remove the flag. You can then freely inspect any :hover css code and see how it’s (not) working.
In chrome dev tools, after you inspect an element, you can right click on the element (make sure to not do this on the body/text or it won’t work) and click on ‘force element state’, then the state you want (e.g. ‘:hover’)
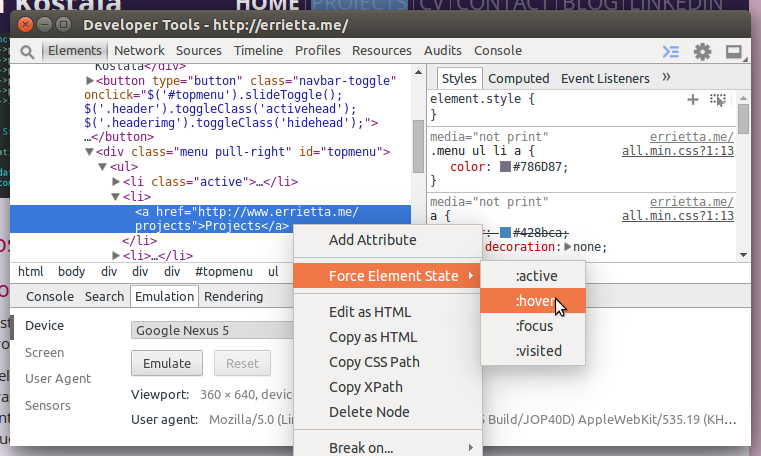
Now, you should see your stylesheet for the :hover state!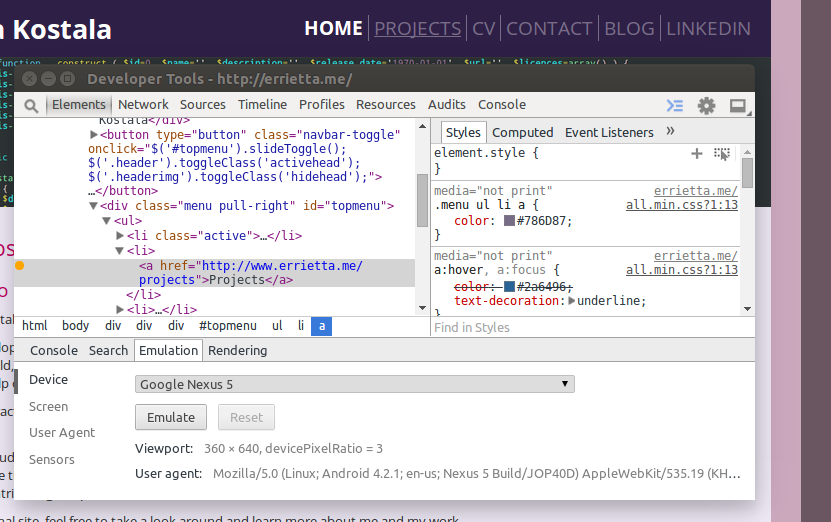
Firefox can do the same by simply right clicking an element and clicking ‘hover’, it again allows you to see the effect of your CSS and see the new :hover code applying.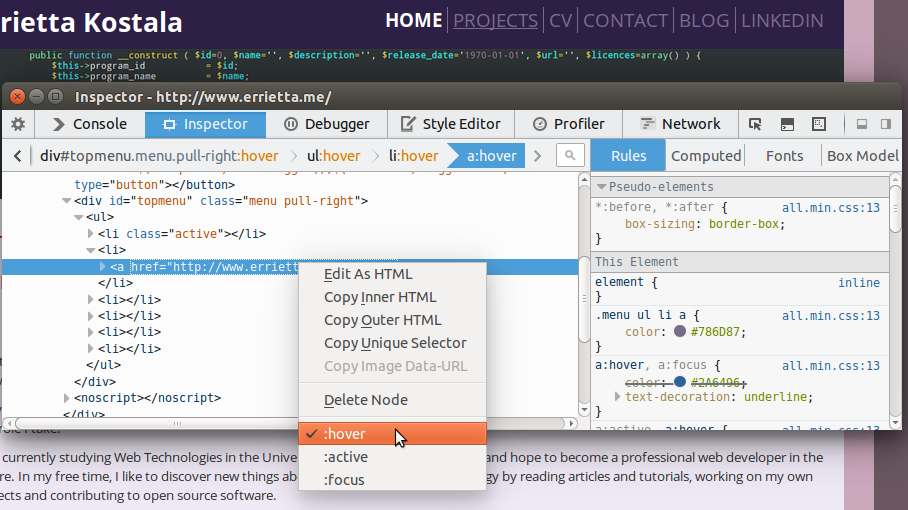
Device emulation
In chrome, you can toggle the bottom pane by pressing ESC on developer tools. Once open, you can choose the ’emulation’ panel. This gives you several options: from screen sizes, to user agents, to whole device setups! Perfect for testing responsive websites.
You can also emulate touch events with your mouse there.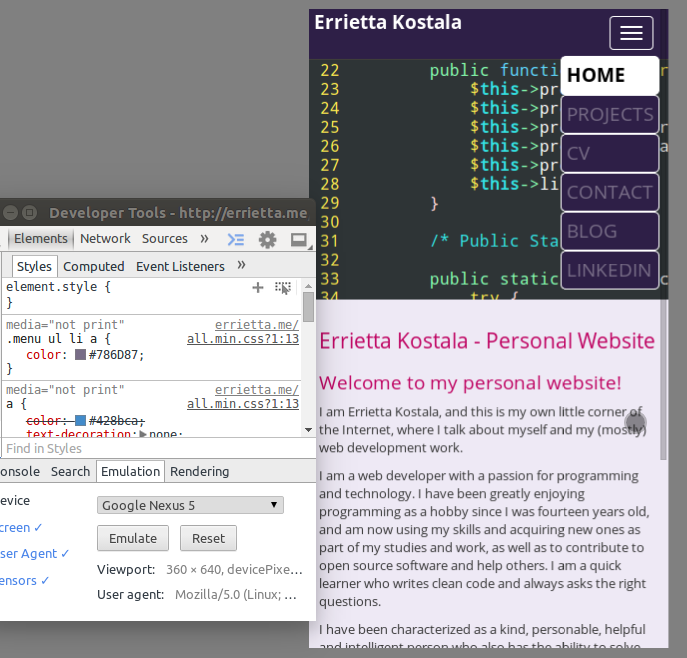
In firefox, there is a little icon on the element inspector that toggles responsive design mode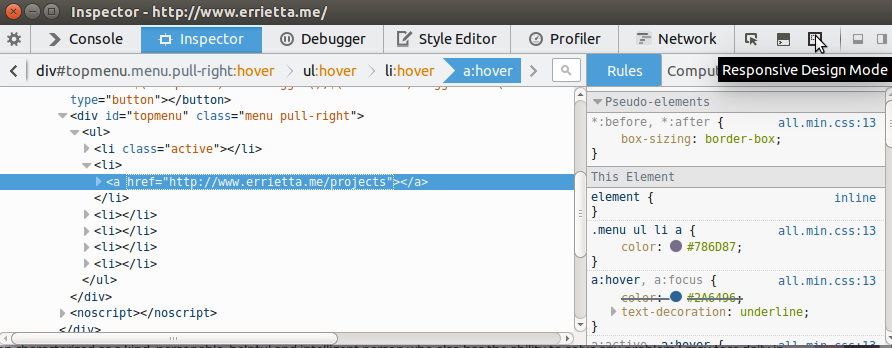
Once clicked, you can again see your website in a variety of sizes.
There’s a dropdown to select a screen size, and you can toggle touch event emulation again or take a screenshot. My favourite feature there though is the ability to rotate the screen with a button!
Networking
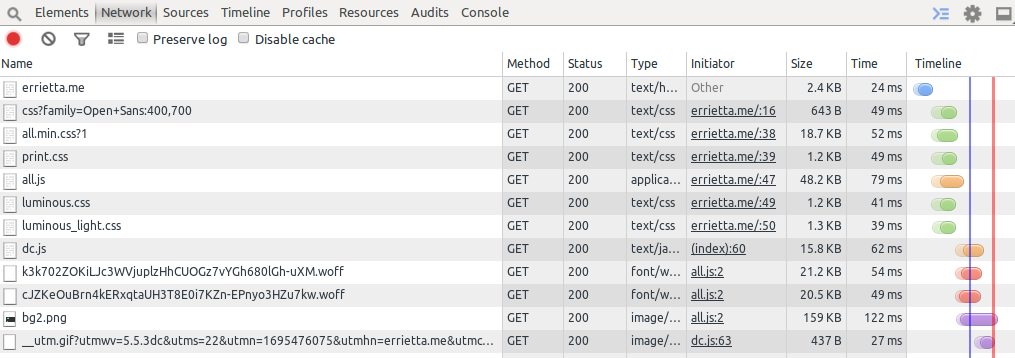
Chrome has a networking tab in its console which allows you to see all your requests and how much time each request took. Apart from being a way to see if you have any slow pages, it also helps diagnose errors such as missing assets and see AJAX requests.
It also shows details for a specific request when clicked, making it easy to see request headers and body – very useful for debugging POST requests.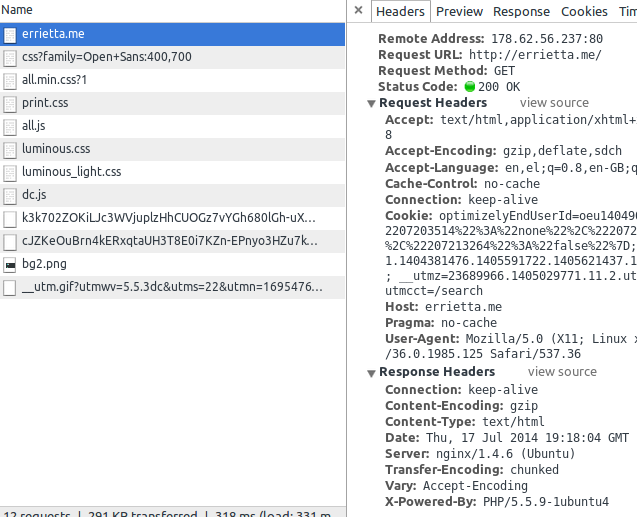
Finally, there’s the ‘audits’ panel which offers some advice on making your page faster, sort of like YSlow and similar extensions.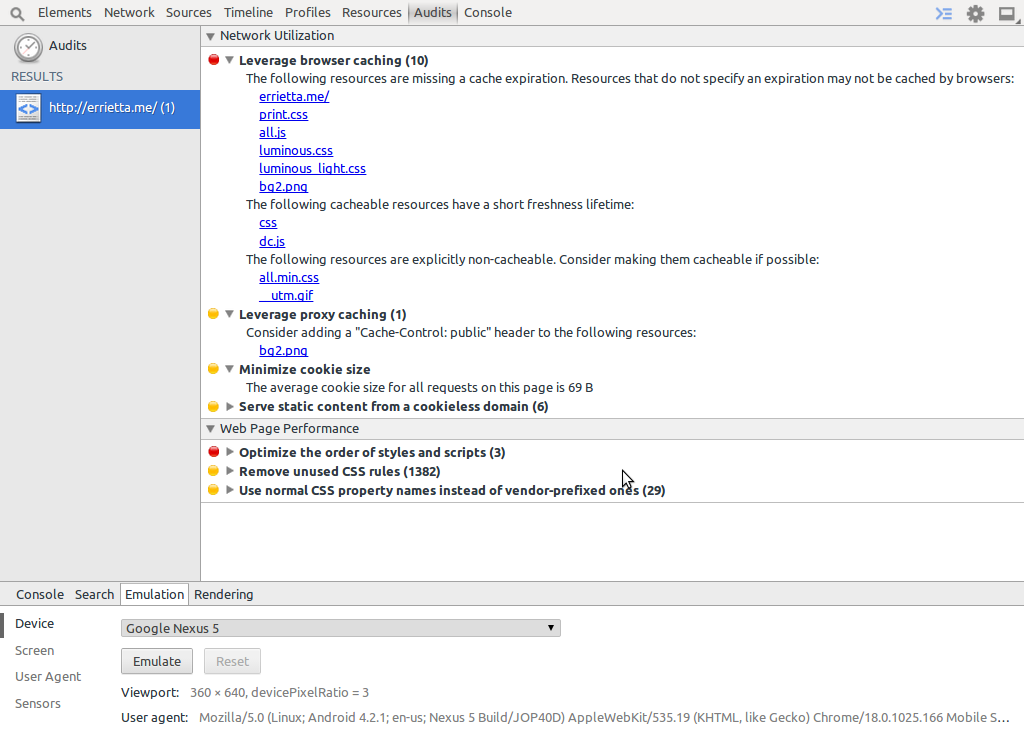
Firefox offers the same functionality in its own networking panel: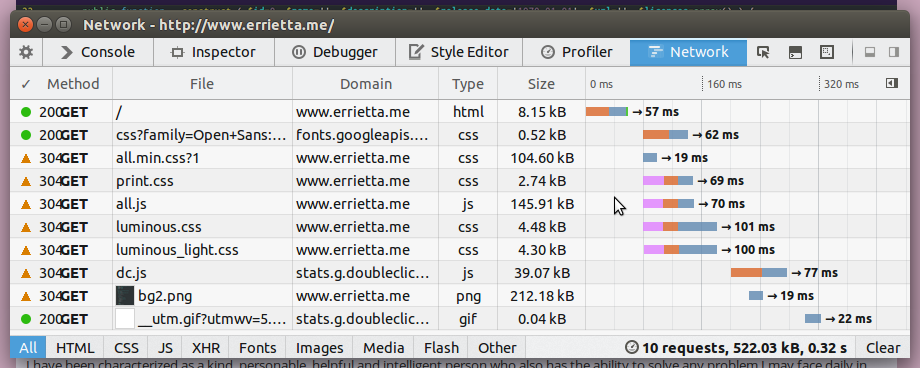
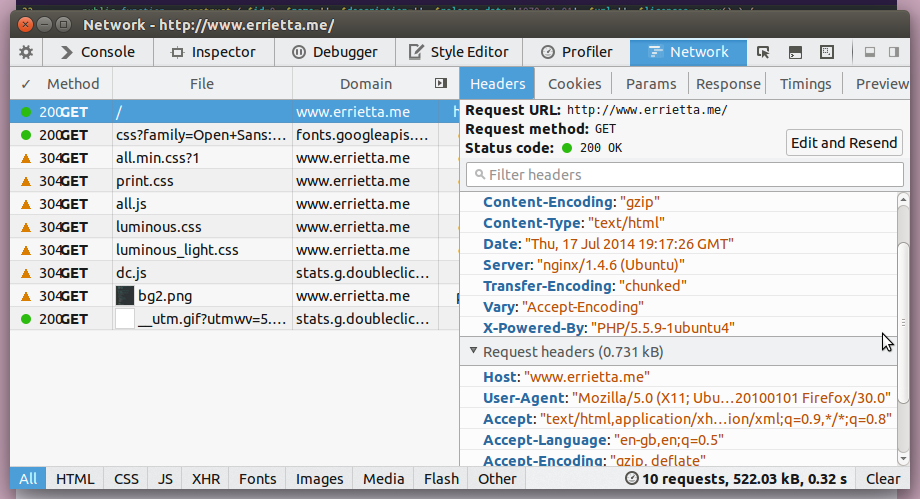
And if you click the little clock on the bottom right, you can see a breakdown of the various page elements and how much time they take
Style editor
If you open a CSS file in sources, chrome allows you to make changes to it on-the-fly, and see if they apply. This, of course, is in addition to being able to see and edit any styles that apply to an element back in the elements panel!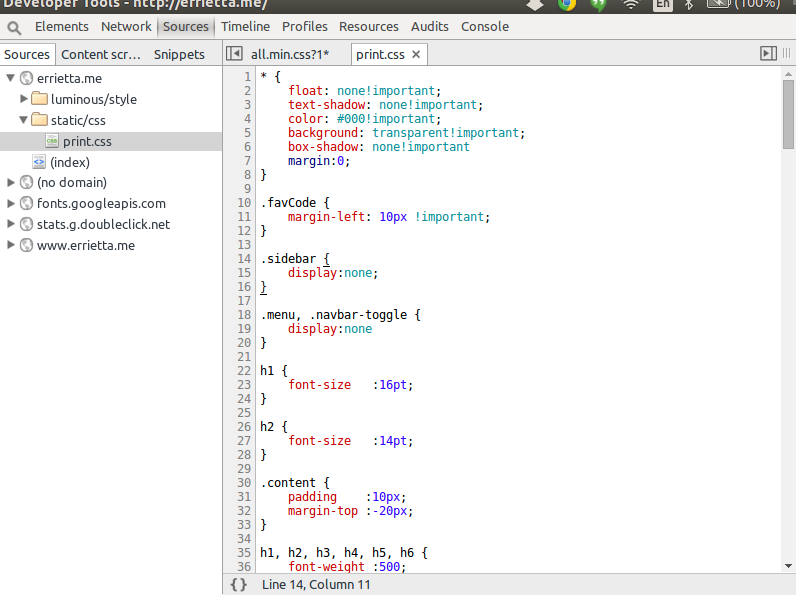
Firefox has a style editor pane that allows the same, as well as adding new stylesheets and importing stylesheets, which is even better.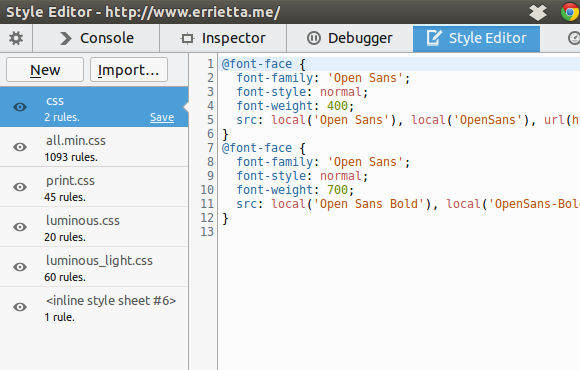
Shader editor
This is a firefox feature I only found out about while writing this post! If you click the little wrench icon in the top left of firefox dev tools, you can enable the shader editor. If you go to a page that uses WebGL afterwards (such as HelloRacer) you can see and edit shader code. Pretty neat!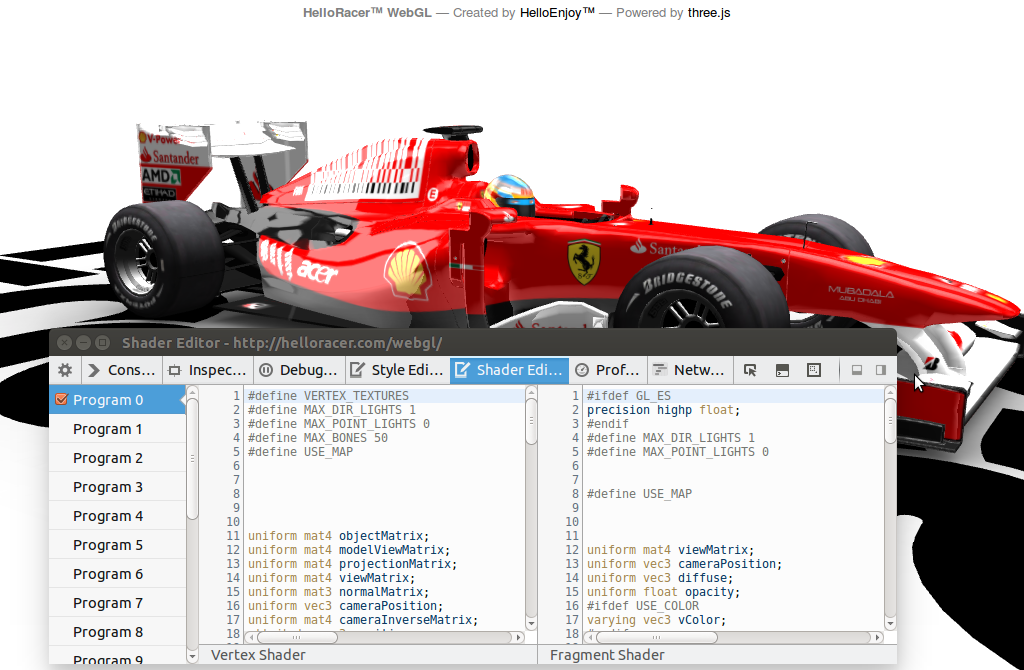
Are there any features you use a lot? Do leave a comment!
Thanks for reading, and see you until next time.